Training and Testing in Python & R
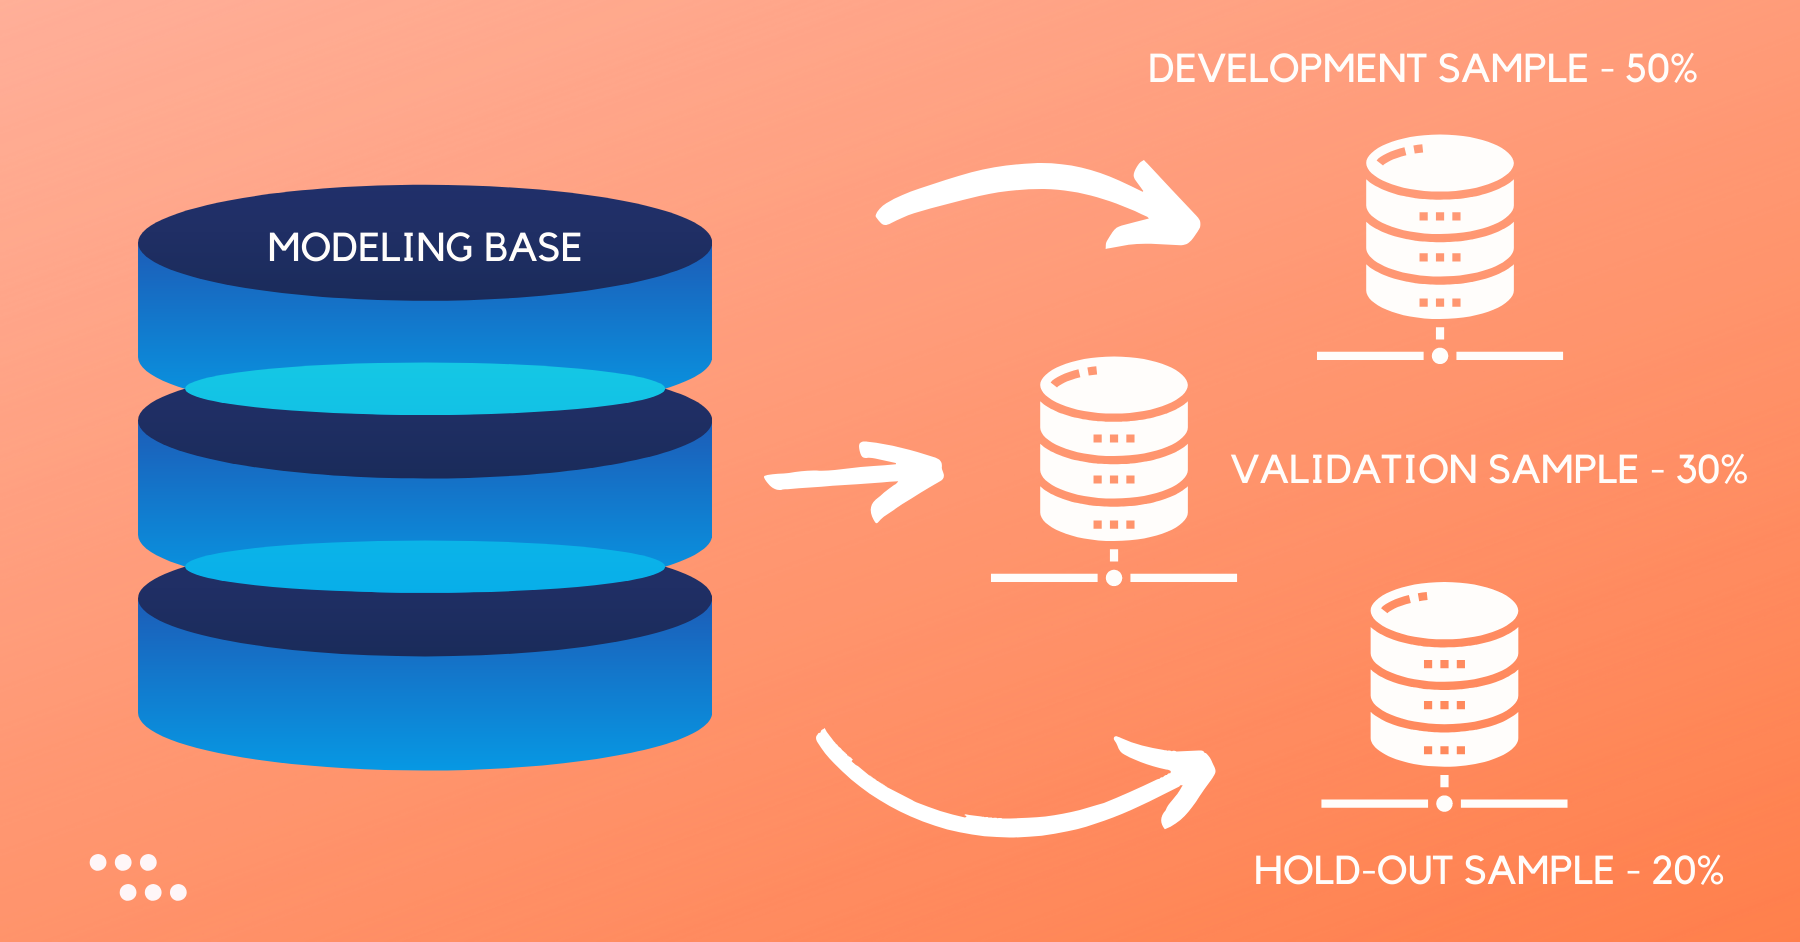
Train/Test is the method used to evaluate supervised machine learning models. Let us see how to split the data in training and testing set in Python & R.
Metadata Understanding
Metadata Data that provide information about other data is called Metadata. In other words, metadata is data about data. Metadata is as important as the data itself because it describes the data. Best practices in variable naming: Self-Explanatory Names - Variable...
Descriptive Statistics – Tabular and Graphical Methods
Tabular Methods are used to summarize the data in table form. Graphical Methods are used to depict data in intuitively understandable charts & graphs.
Linear Regression in Machine Learning
This blog series provides a detailed step-by-step guide to building the Linear Regression Machine Learning model with Python and R code.
Introduction to Statistics for Data Science
Data science is an inter-disciplinary field that uses scientific methods, systems to extract knowledge from structural and unstructured data.
Coefficient of Variation
Coefficient of Variation (CoV) is a measure of relative variability. CoV is calculated as the ratio of standard deviation (SD) to mean. It is unit less.
Measures of Dispersion | Standard Deviation and Variance
Standard Deviation is a measure of how much the data is dispersed from its mean. Population standard deviation is often denoted by Greek symbol σ or SD
Introduction to Logistic Regression
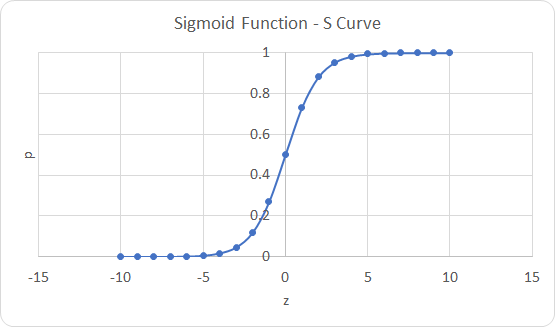
Logistic Regression is a machine learning technique which is used to model the probability of an event or class having a binary outcome.
Measures of Dispersion | Interquartile range
Interquartile Range (IQR) is the range of middle 50% of the values in the data distribution. It is the difference between the third quartile (Q3) and the first quartile (Q1).


