Jun 15, 2020 | Data Science, Python Programming, Statistics
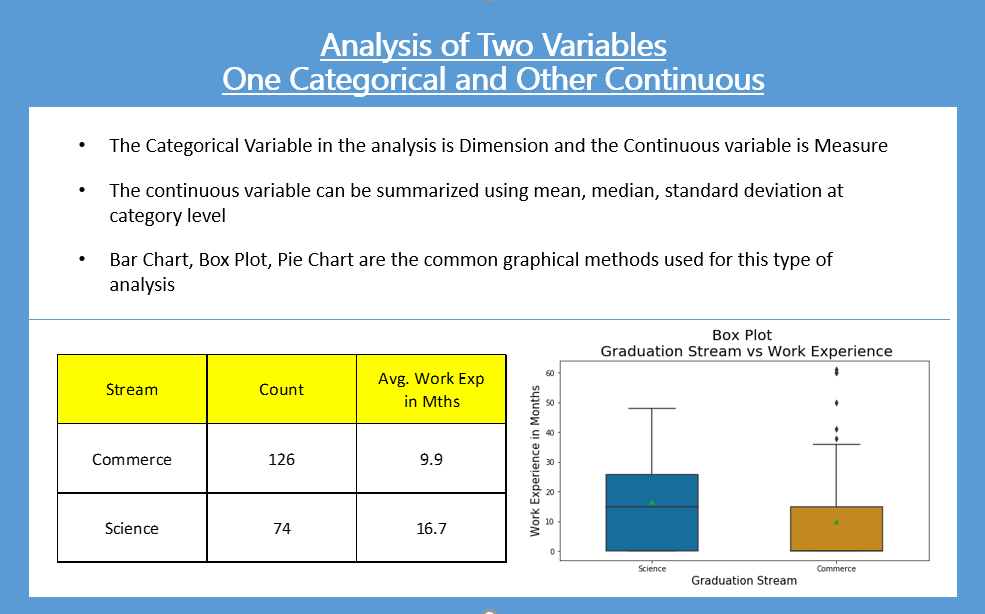
Bar Plot and Box Plot When we analyze two variables, one categorical and the other continuous, the objective is often to see the sum or mean of the continuous variables by categories and compare...
Jun 10, 2020 | Data Science, R Programming, Statistics
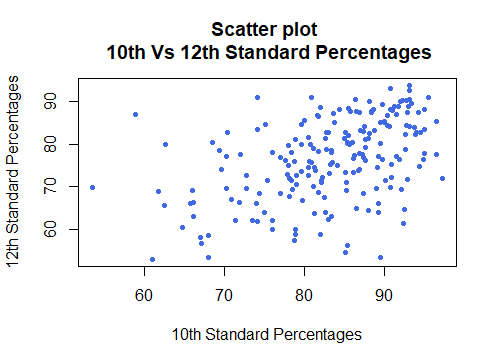
Analysis of Two Continuous Variables In the earlier blogs, we have learned about the Analysis of Single Continuous and Single Categorical variable. In this blog, we will analyze Two Continuous...
Jun 9, 2020 | Data Science, Python Programming, Statistics
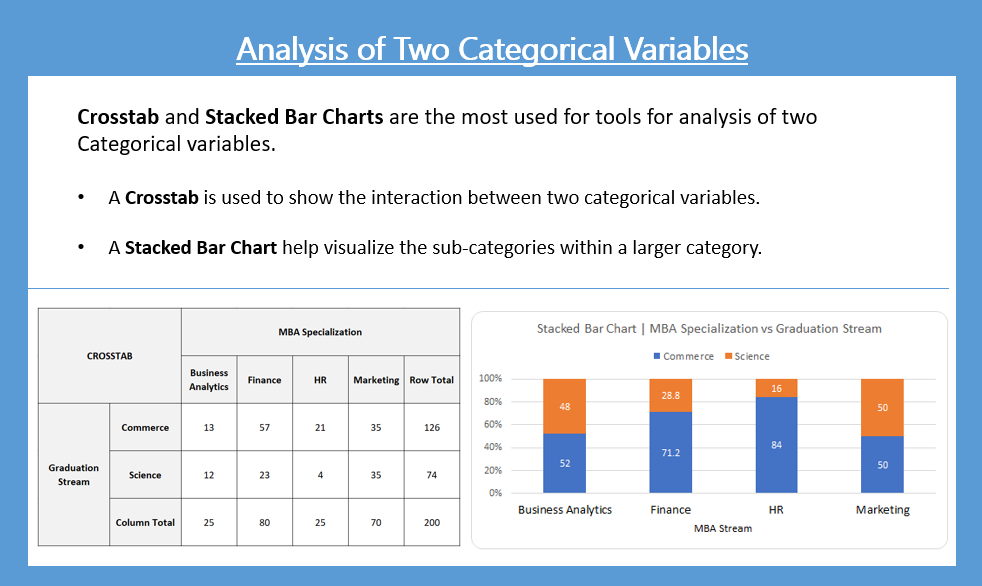
Analysis of Two Categorical Variables Crosstab is the most preferred way of analyzing two categorical variables. It helps you to identify the affinity between the two categories. Graphically a...
Jun 6, 2020 | Data Science, Python Programming, Statistics
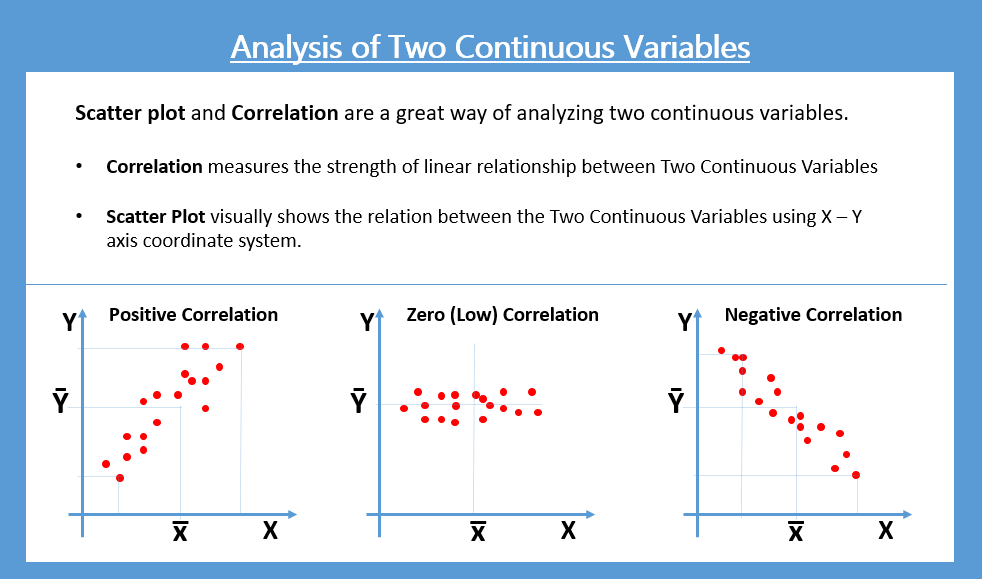
Analysis of Two Continuous Variables Scatter plot and Correlation are a great way of analyzing two continuous variables. A Scatter plot quickly helps us see the relationship between two continuous...
Jun 5, 2020 | Data Science, Machine Learning, Statistics
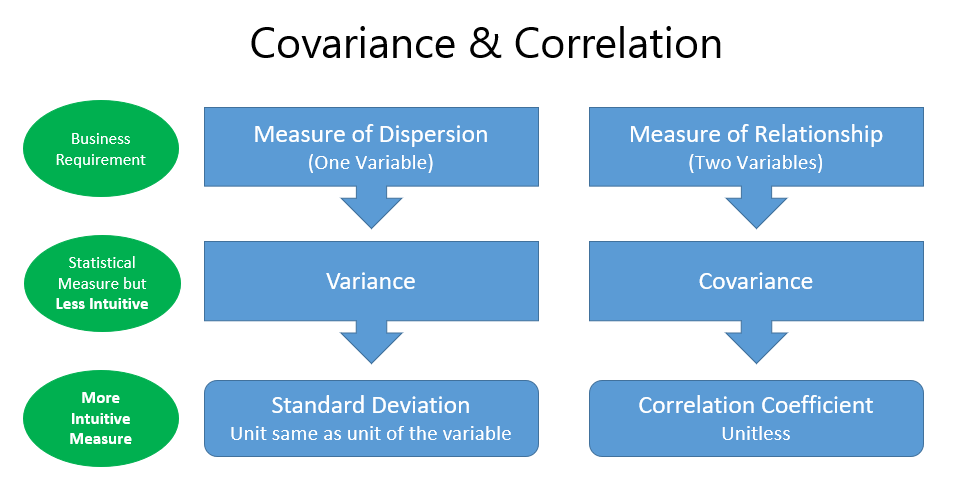
Measures of Relationship Definition: The statistical measures which show a relationship between two or more variables are called Measures of Relationship. Correlation and Regression are commonly...


Recent Comments